Picture a crowded hospital triage floor at precisely 2:14 PM on a Tuesday afternoon. A clinical team rushes to catalog incoming patient symptoms, vital signs, and suspected environmental exposures all at once. They are not following these patients for years, nor are they manipulating a controlled variable in a laboratory incubator. Instead, they are taking a high-resolution snapshot of a population at a single, frozen coordinate in time. This is the heartbeat of observational research: capturing reality as it exists without altering its course.
For decades, researchers across public health, sociology, market analytics, and general clinical practice have relied on this exact methodology to map the terrain of human behavior and disease distribution. Yet, mistaking a prevalence snapshot for a longitudinal trajectory is a perennial trap. Knowing precisely when to deploy a cross-sectional study—and more importantly, knowing its hard boundaries—separates amateur data-gathering from rigorous scientific inquiry.
The Anatomy of a Single-Moment Snapshot and Its Core Mechanics
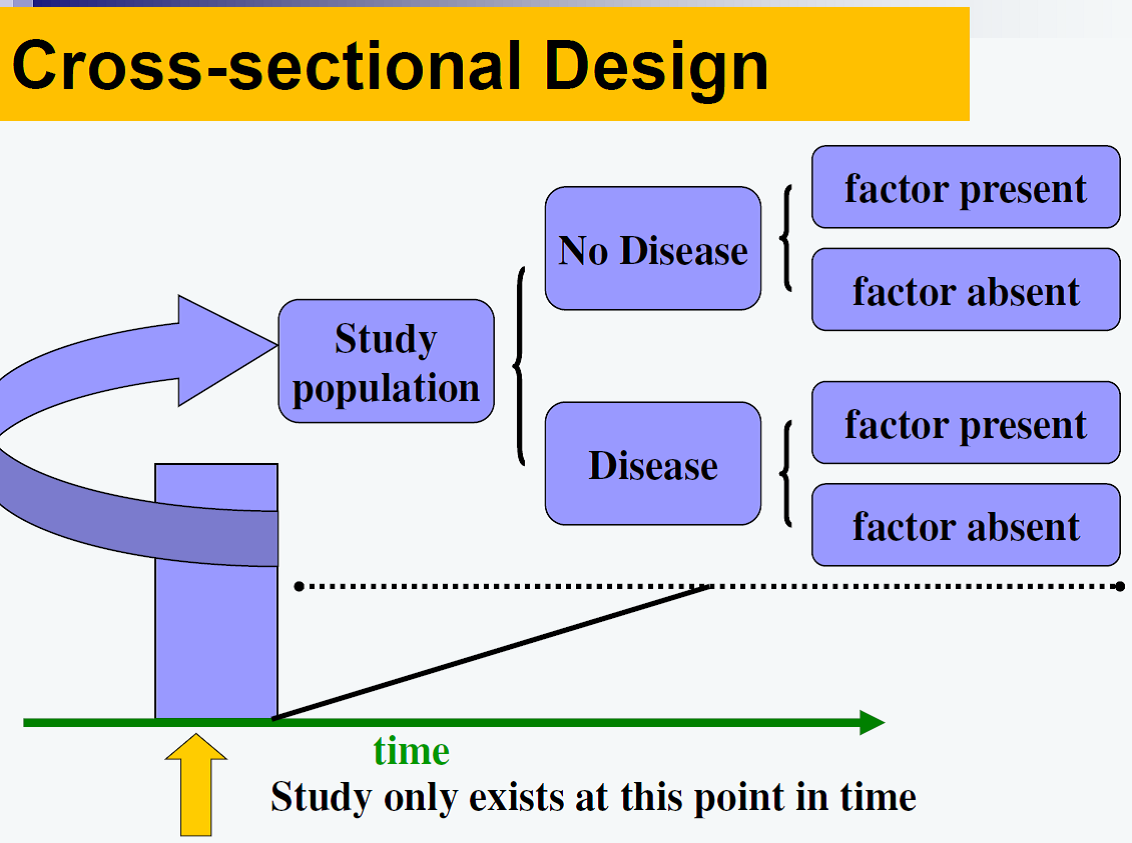
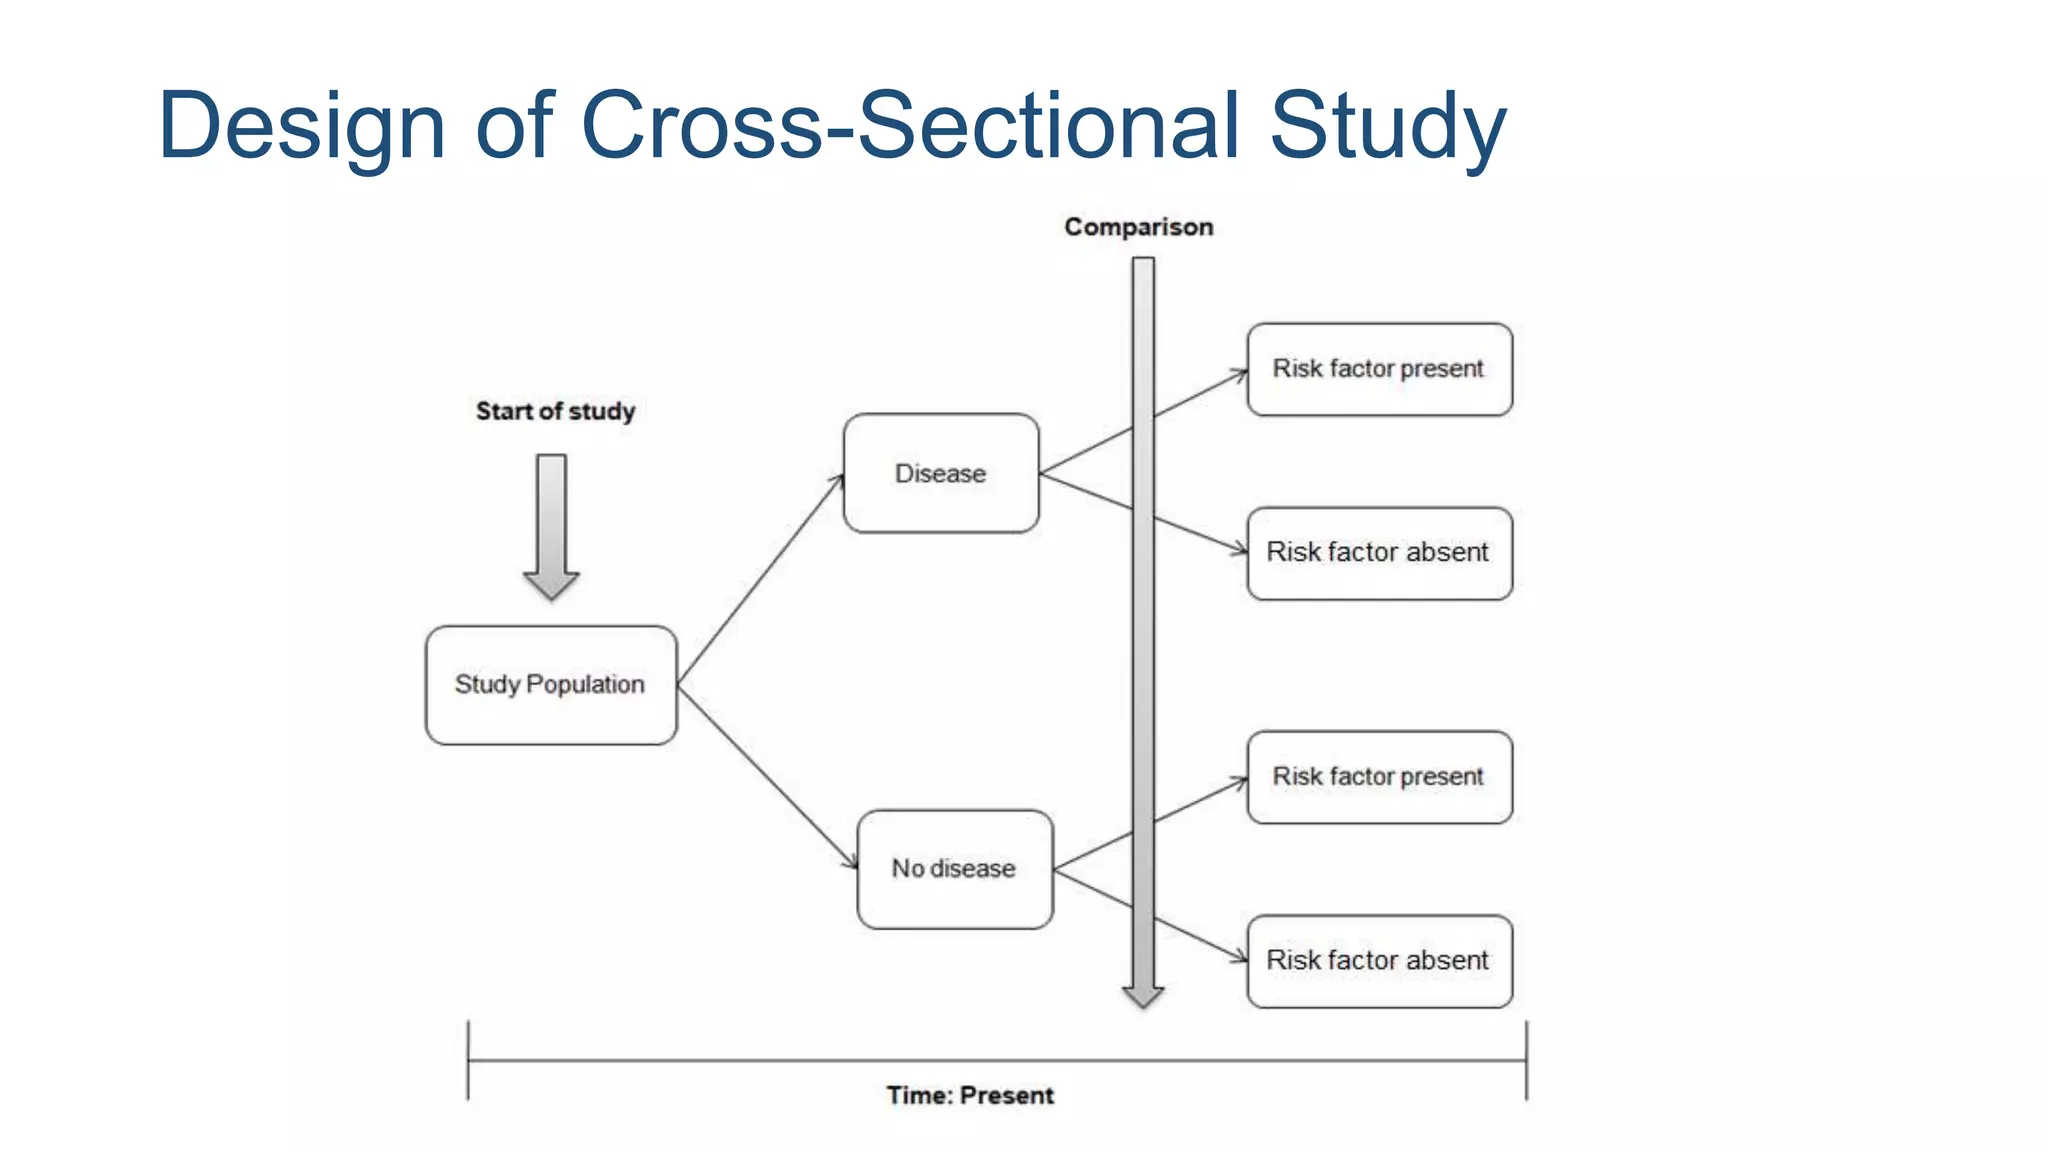
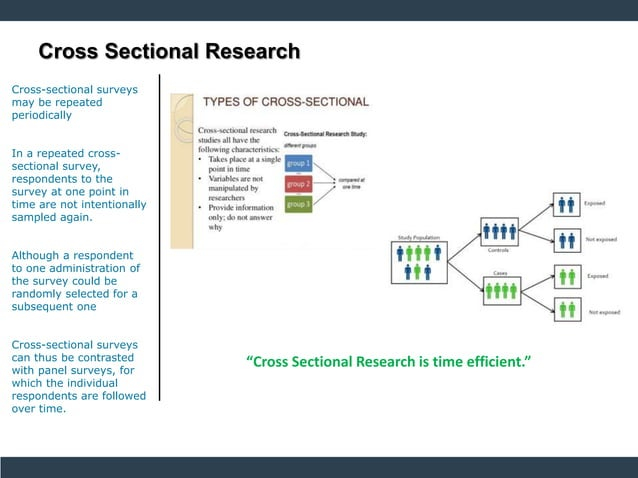
At its most fundamental level, a cross-sectional study measures both exposure and outcome simultaneously among study participants. Unlike a cohort study that tracks individuals forward from a known exposure, or a case-control design that looks backward from a known disease state, the cross-sectional design freezes time. Imagine dropping a net over an entire community on a rainy Wednesday morning and recording who carries a respiratory illness and who recently used a specific public transit line. You capture the prevalence of the condition, the frequency of the exposure, and the statistical association between them within the exact same time frame.
This simultaneous collection model makes these studies invaluable for prevalence estimation. Public health institutions frequently leverage this design to gauge the immediate burden of disease within a given jurisdiction. For instance, assessing the baseline prevalence of chronic hypertension across an urban center provides policymakers with actionable data on healthcare demand, regional health disparities, and resource allocation. Because researchers do not wait for future events to unfold, the logistical turnaround time shrinks dramatically. Data collection happens via rapid surveys, electronic health record auditing, or structured community interviews.
However, this structural convenience comes with a heavy analytical tax: the temporal ambiguity dilemma. When you measure exposure and outcome simultaneously, proving which one came first becomes a formidable statistical puzzle. Did the sedentary lifestyle cause the depressive symptoms, or did severe depression lead to a sedentary lifestyle? Cross-sectional data alone cannot definitively untangle this chicken-and-egg dilemma. Acknowledging this limitation is not a confession of failure; rather, it is the foundational step toward using the methodology correctly.
Weighing the Strategic Advantages Against Inherent Analytical Limits
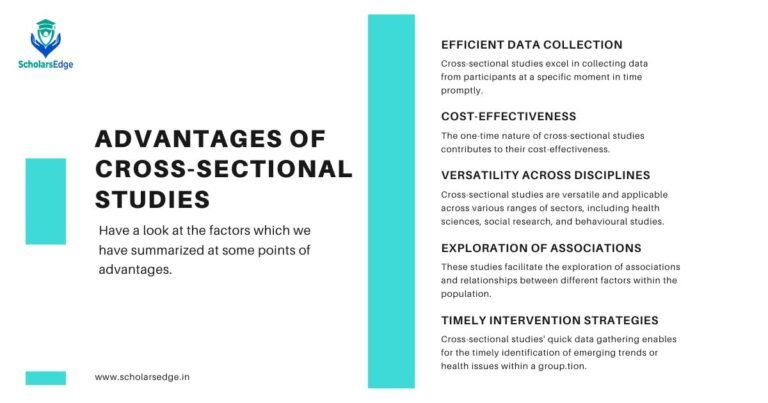
Every research design involves compromises, and the cross-sectional approach is a masterclass in trading causal certainty for operational efficiency. Speed and cost stand out as the primary assets of this methodology. Funding agencies and corporate research boards operate under tight fiscal constraints and aggressive timelines. Mobilizing a multi-year cohort study requires millions of dollars in continuous tracking, participant retention efforts, and long-term administrative overhead. In contrast, a well-designed cross-sectional survey can be fielded, cleaned, and analyzed within weeks or months, delivering rapid intelligence when decision-makers need it most.
Beyond economics, cross-sectional designs excel at descriptive mapping and hypothesis generation. They provide a panoramic view of population characteristics, allowing investigators to uncover unexpected correlations across diverse demographic variables. When a researcher notices a statistically significant clustering of a specific behavioral pattern among a particular age cohort, that observation serves as the launching pad for subsequent, more rigorous analytical studies. It acts as an early-warning radar system, highlighting areas that demand deeper experimental or longitudinal scrutiny.
Yet, the limitations remain formidable. Beyond the temporal ambiguity already noted, these studies are acutely vulnerable to prevalence-Neyman bias—often referred to as survival bias. Because the sample reflects only those individuals present and surviving at the moment of the study, fast-acting conditions with high early mortality rates or transient states that resolve quickly may be systematically underrepresented. A cross-sectional survey of occupational lung disease in a chemical plant, for example, will completely miss the workers who became critically ill and quit or passed away before the survey date, painting a deceptively optimistic picture of workplace safety.
A Step-by-Step Blueprint for Designing a Rigorous Cross-Sectional Study
Executing a cross-sectional study that withstands peer review and delivers genuine empirical value requires strict adherence to methodological protocols. Cutting corners during the sampling phase or phrasing survey items ambiguously will corrupt the entire dataset, rendering any subsequent statistical modeling meaningless.
- Step 1 (Define the Target Population and Sampling Frame): Clearly delineate the exact demographic, geographic, or institutional parameters of the group you intend to study, ensuring your sampling frame accurately mirrors that population without systematic exclusion.
- Step 2 (Select an Appropriate Sampling Technique): Utilize probability sampling methods—such as stratified random sampling or multi-stage cluster sampling—to minimize selection bias and guarantee that every subgroup has a known, non-zero chance of inclusion.
- Step 3 (Develop and Validate Measurement Instruments): Construct standardized questionnaires, diagnostic tests, or observation logs, and pilot-test them on a small auxiliary group to eliminate leading questions, ambiguous phrasing, and technical glitches.
- Step 4 (Execute Simultaneous Data Collection): Administer your instruments to capture exposure, outcome, and relevant confounding variables concurrently, maintaining rigorous data hygiene and high response rates to prevent attrition bias.
- Step 5 (Apply Appropriate Statistical Modeling): Analyze the dataset using prevalence ratios, odds ratios via logistic regression, or multivariable adjustments to control for measured confounders while explicitly noting the descriptive nature of your findings.
Navigating Common Methodological Traps and Field-Tested Workarounds
Even experienced investigators occasionally stumble when translating cross-sectional concepts into fieldwork reality. Recognizing these frequent missteps and applying proven workarounds preserves the integrity of your findings.
- Pitfall 1 (Mistaking Association for Causation): Assuming that a strong statistical correlation uncovered in a single-moment survey proves a direct cause-and-effect relationship. Workaround: Explicitly frame all interpretations around prevalence and association, reserving causal claims for subsequent experimental or longitudinal follow-ups.
- Pitfall 2 (Non-Response Bias Distortion): Allowing low participation rates to skew results because individuals with the outcome of interest systematically decline to participate. Workaround: Implement aggressive follow-up protocols, incentive structures, and non-respondent analyses to compare demographic profiles of participants versus refusers.
- Pitfall 3 (Information and Recall Bias): Relying entirely on retrospective self-reporting for exposures that occurred months or years prior, leading to inaccurate data entry. Workaround: Pair self-reported surveys with objective biomarkers, administrative database records, or standardized observational audits wherever feasible.
- Pitfall 4 (Failure to Control for Confounders): Neglecting third-party variables—such as socioeconomic status, age, or underlying health conditions—that distort the observed relationship between exposure and outcome. Workaround: Design data collection instruments to capture extensive baseline covariates and apply multivariable regression techniques during analysis.
- Pitfall 5 (Inappropriate Generalizability): Extrapolating findings from a highly specific, localized cross-sectional sample to an entirely different global or cultural population. Workaround: Clearly define the boundary conditions of your sample in the research report and restrict conclusions strictly to the population actually sampled.
Integrating Configurational Perspectives and Mixed-Method Frameworks
Modern research demands sophistication that goes beyond simple bivariate cross-tabulations. Contemporary data scientists and subject-matter experts increasingly adopt configurational perspectives, recognizing that human behavior and health outcomes are rarely driven by a single isolated variable. Instead, outcomes emerge from complex, intersecting combinations of environmental, behavioral, and biological factors. By utilizing advanced analytical techniques like Qualitative Comparative Analysis (QCA) alongside traditional cross-sectional data, researchers can model multiple interacting pathways rather than searching for a single linear culprit.
Furthermore, integrating cross-sectional quantitative surveys with qualitative deep-dives creates a powerful mixed-method synergy. While a cross-sectional survey tells you what percentage of a population exhibits a specific operational behavior at a given moment, accompanying focus groups or semi-structured interviews explain why those patterns exist beneath the surface. This blending of breadth and depth bridges the gap between cold numerical metrics and authentic human insight, transforming a standard statistical report into a compelling narrative of lived reality.
The economic value of this integrative approach is substantial. Organizations and public agencies face mounting pressure to demonstrate return on investment for every dollar spent on research and intervention design. Deploying a rapid, cost-effective cross-sectional baseline study allows stakeholders to pinpoint systemic friction points, allocate resources dynamically, and establish a foundational benchmark against which future longitudinal interventions can be measured.
Actionable Recommendations for Practitioners and Investigators
Translating theoretical research design into operational excellence requires a disciplined adherence to professional standards and transparent reporting frameworks. Whether you are investigating workplace ergonomics, public health service utilization, or consumer adoption curves, certain rules remain absolute.
First, prioritize transparency in your reporting. Following established guidelines like STROBE (Strengthening the Reporting of Observational Studies in Epidemiology) ensures that your methodology, sampling frame, and potential sources of bias are laid bare for peer evaluation. Hidden sampling flaws or vague inclusion criteria instantly undermine the credibility of an otherwise brilliant dataset.
Second, treat the cross-sectional design as a strategic stepping stone rather than a standalone endpoint. Use the insights gleaned from your prevalence snapshot to design targeted cohort studies, clinical trials, or qualitative ethnographies. Think of the cross-sectional approach as the master map that helps you locate the territory; you still need specialized tools to explore every mountain and valley.
Finally, remain rigorously humble about what your data can and cannot prove. Acknowledge temporal limitations openly in your abstracts and executive summaries. By honoring the boundaries of the methodology, you protect the integrity of your work and earn the enduring trust of decision-makers, peers, and the public.
Observational research asks us to be patient witnesses to a complex world. It requires us to step into the noise of human experience, record what we see with absolute fidelity, and resist the temptation to force simple narratives onto messy realities. The cross-sectional approach remains one of our most potent instruments for capturing these fleeting moments in time.
As data collection tools grow increasingly sophisticated and analytical frameworks expand to embrace complexity, the foundational tenets of observational integrity remain unchanged. Clear thinking, rigorous sampling, and honest interpretation will always outperform flashy statistics built on shaky foundations. By understanding precisely when to deploy a cross-sectional study and respecting its inherent boundaries, we unlock a clearer, more nuanced view of the populations we strive to understand.